| Nodejs | Grafana | Prometheus |
Đối với mình việc monitor hệ thống rất quan trọng. Nó là những thông tin để developer theo dõi được tình hình của hệ thống. Kiếm soát được khi nào hệ thống bị quá tải, các chỉ số của các request đến server.
1. Đơn giản để dễ triển khai.
- Mình chọn grafana + prometheus. Và để đơn giản hơn nữa mình sẽ setup luôn bằng Docker.
- Vì dự án mình đang làm đã live, và đang quản lý bằng PM2 nên chưa thể chạy application bằng docker như những bài hướng dẫn khác.
- Nên trong bài này mình sẽ hướng dẫn cách tích hợp grafana + prometheus một cách đơn giản nhất vào hệ thống chạy bằng NodeJS nha.
2. Bắt đầu thôi nào.
- Chúng ta sẽ sử dụng lại project này để ứng dụng: typescript đơn giản
- Sử dụng một gói npm để hỗ trợ việc lấy ra những thông số của server nhé: prom-client.
- Chúng ra sẽ sử dụng một npm nữa là middleware cho
expressjsđể expose metrics cho prometheus: express-prometheus-middleware - Oke, sau khi đã npm install đầy đủ và run được project lên. Chúng ta sẽ sửa một vài thứ trong code nhé.
- Trong file
app.ts, thêmconst promMid = require('express-prometheus-middleware')vìexpress-prometheus-middlewarechưa hỗ trợ typescript nên vẫn phải require như bên js - Tiếp tục bổ sung thêm function:
  private _setMonitor() {
    this.app.use(promMid({
      metricsPath: '/metrics',
      collectDefaultMetrics: true,
      requestDurationBuckets: [0.1, 0.5, 1, 1.5],
    }))
  }
- Và gọi function
_setMonitor()trongconstructornhé:
  constructor() {
    this.app = express()
    this._setConfig()
    this._setMonitor()
    this._loadRoute()
  }
//lưu ý là phải để _setMonitor() trên _loadRoute()
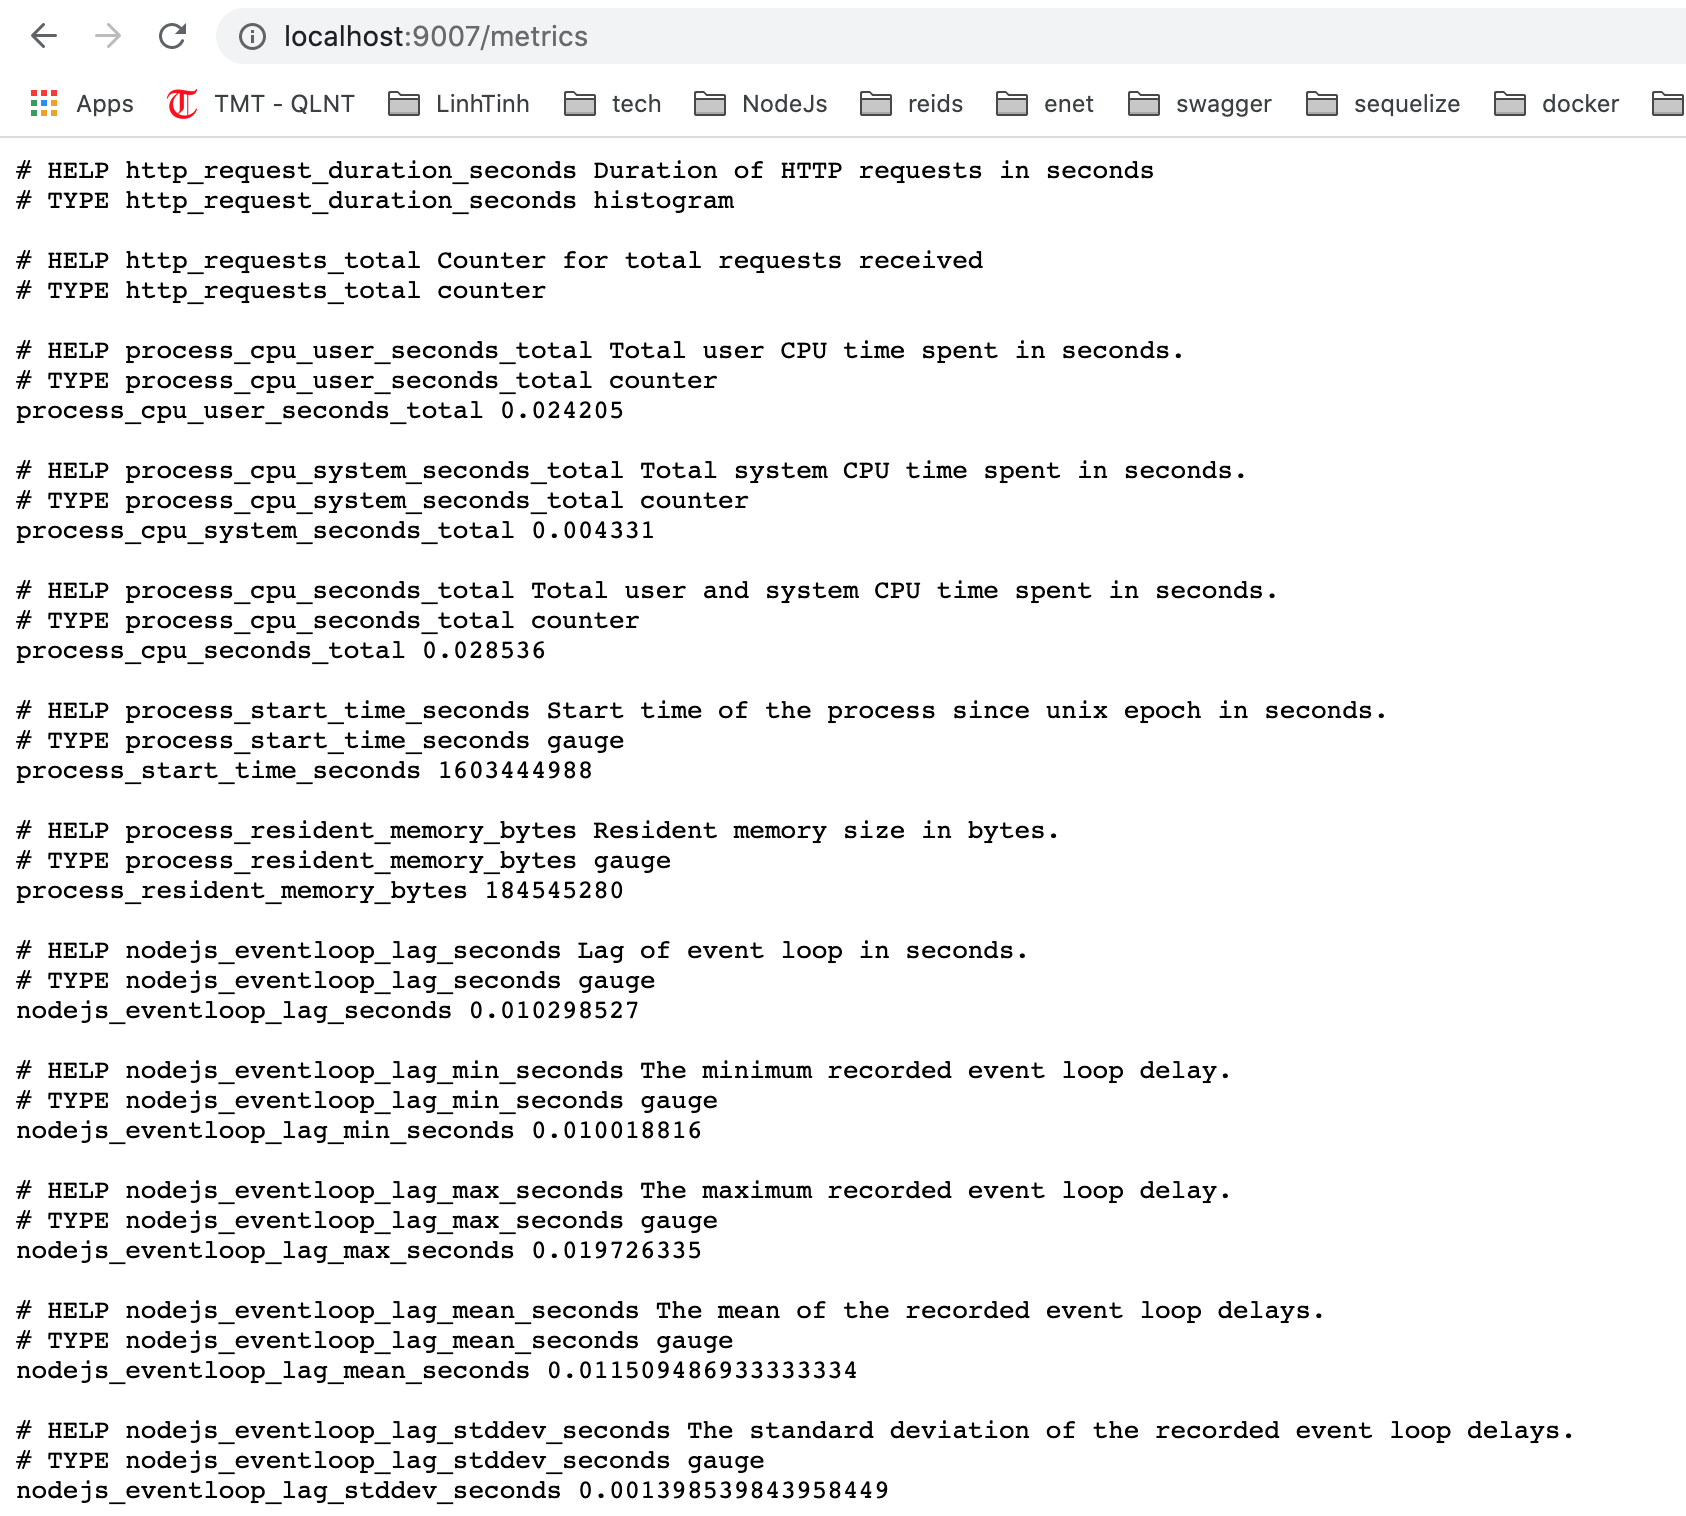
- Bây giờ hãy restart lại server và truy cập vào: http://localhost:9007/metrics chúng ta sẽ xuất hiện trang:

Thông số cơ bản
- Thử gọi một api http://localhost:9007/api/gettodos vào f5 lại trang metrics nhé. Chúng ra cũng sẽ thấy chỉ số tương ứng với api đó.
3. Cài đặt Grafana và Prometheus
- Để đơn giản nhất chúng ta cài đặt grafana và prometheus bằng docker. Một lệnh làm tất cả 😄
- Tạo thư mục
monitorcùng cấp vớisrcnhé. Trongmonitortạo filedocker-compose.ymlnhư sau:
version: "3.4"
services:
  prometheus:
    image: prom/prometheus:latest
    ports:
      - 9090:9090
    command:
      - --config.file=/etc/prometheus/prometheus.yml
    volumes:
      - ./prometheus.yml:/etc/prometheus/prometheus.yml:ro

  grafana:
    image: grafana/grafana
    ports:
      - 3000:3000
    volumes:
      - grafana-storage:/var/lib/grafana
    restart: always
    depends_on:
      - prometheus
volumes:
  grafana-storage:
- Ok, các thông tin rất cơ bản. Nhưng lưu ý máy của bạn cũng phải cài đặt docker và docker-compose rồi nhé.
- Để chạy được prometheus chúng ta cần tạo file config đó là
prometheus.ymlở trong thư mụcmonitornhé:
# my global config
global:
  scrape_interval: 5s # Set the scrape interval to every 15 seconds. Default is every 1 minute.
  evaluation_interval: 5s # Evaluate rules every 15 seconds. The default is every 1 minute.
  # scrape_timeout is set to the global default (10s).

  # Alertmanager configuration
alerting:
  alertmanagers:
    - static_configs:
        - targets:
          # - alertmanager:9093

          # Load rules once and periodically evaluate them according to the global 'evaluation_interval'.
rule_files:
  # - "first_rules.yml"
  # - "second_rules.yml"

  # A scrape configuration containing exactly one endpoint to scrape:
  # Here it's Prometheus itself.
scrape_configs:
  # The job name is added as a label `job=<job_name>` to any timeseries scraped from this config.
  - job_name: "prometheus"
    # metrics_path defaults to '/metrics'
    # scheme defaults to 'http'.
    static_configs:
      - targets: ["192.168.10.16:9007"]
- Lưu ý phần
targets: ["192.168.10.16:9007"]sửa lại đúng với địa chỉ ip máy của bạn nha. - Bây giờ chạy thử xem sao.
cdvàomonitorvà chạydocker-compose up -d - Kiểm tra lại bằng
docker pskhi thấy 2 container củagrafanavàprometheusđã run là Ok rồi nha. - Hoặc có thể truy cập vào: http://localhost:9090 để xem prometheus.
- Truy cập vào: http://localhost:3000 để vào trang của grafana, login bằng tài khoản mặc định
admin:admin.
4. Thiết lập dashboard trên grafana
- Sau khi đã login chọn

Chọn data source
- Chọn prometheus

Chọn Prometheus
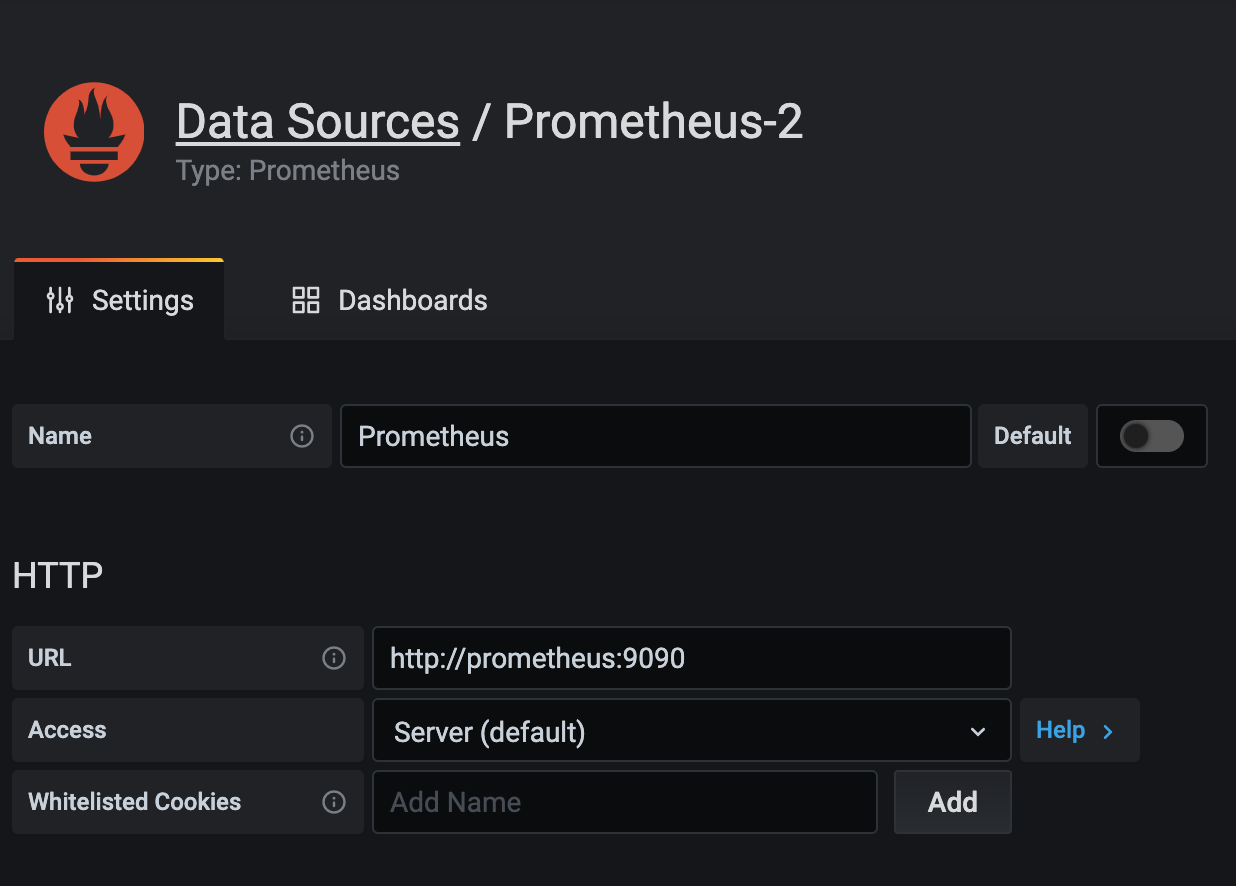
- Và setup như sau:

Setup
- Bấm
Save & Testvà xuất hiệnData source is workinglà thành công rồi nha. - Quay lại trang chủ và chọn
Create your first dashboardđể tự tạo graph. - Bạn có thể import những dashboard có sẵn tại đây: dashboard grafana nodejs
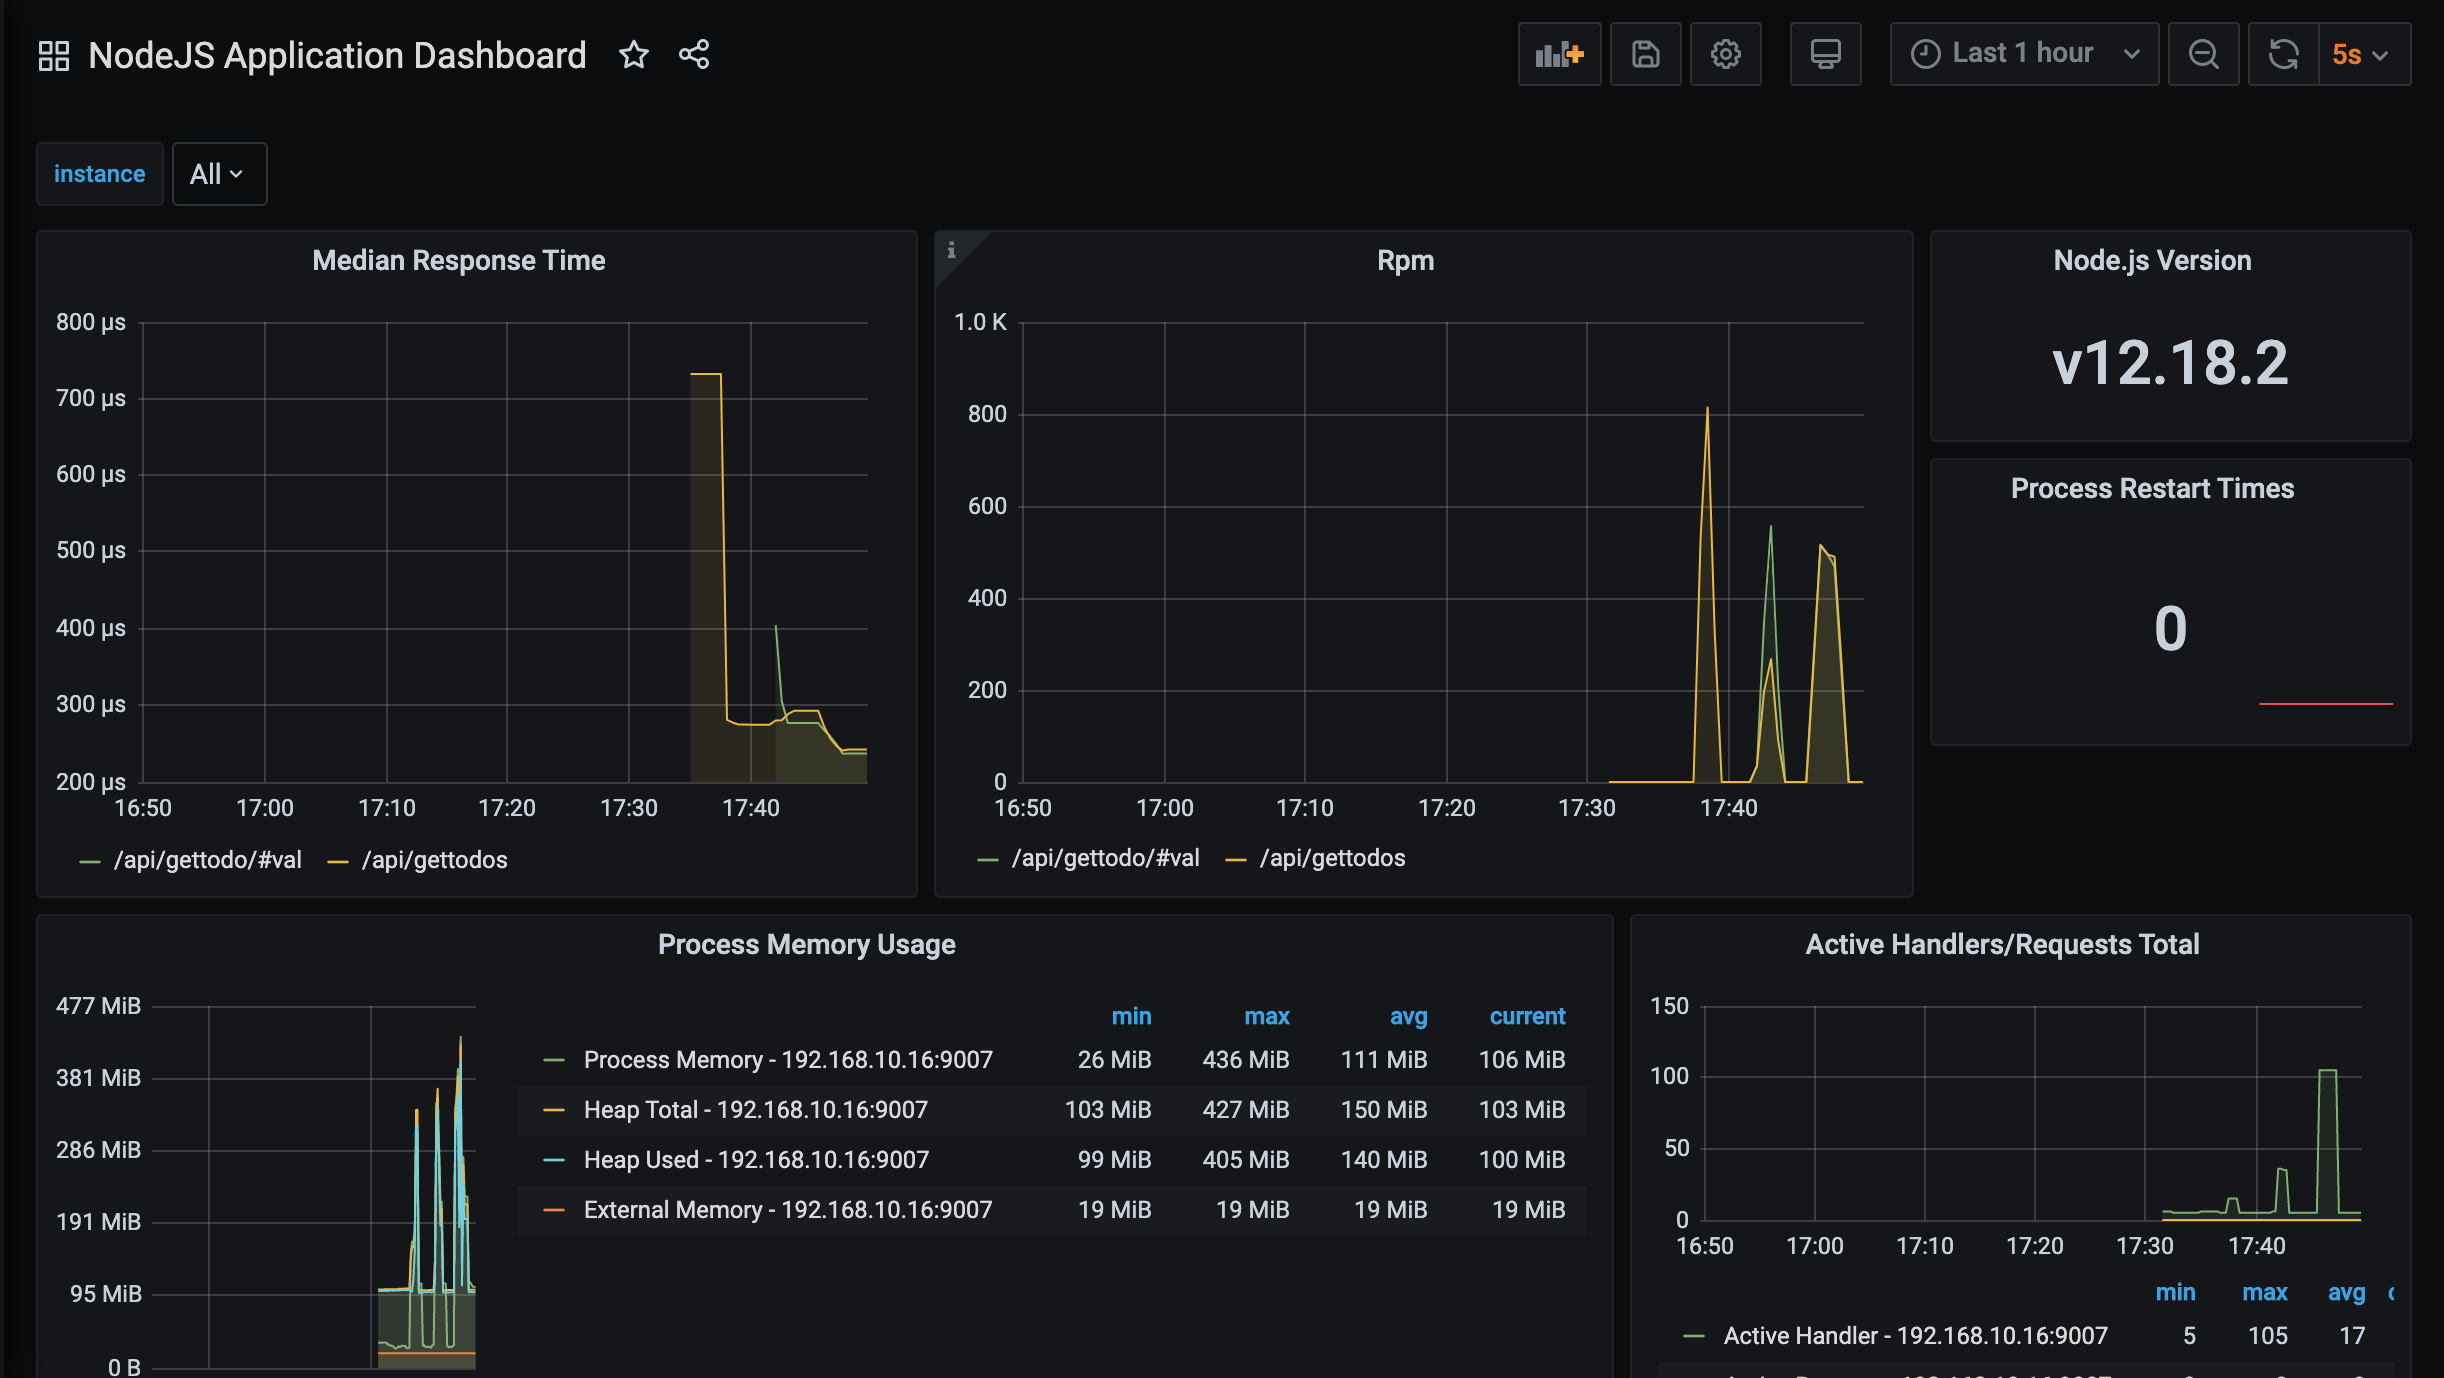
- Mình có kết hợp với dashboard có sẵn và bổ sung thêm thông tin về response. Dữ liệu mình để trong file NodeJSApplicationDashboard.json. Có thể import bằng file json nhớ.
- Chúng ta sẽ có 1 dashboard nhìn ngon hơn.
- Bây giờ sẽ xử dụng ab hoặc wrk để bắn thử request đến server rồi xem các thống số hiện thị trên board nhé.
wrk -t1 -c10 -d60s http://localhost:9007/api/gettodos - Chạy 1 thread với 10 connections trong vòng 60s.

Kết quả
- Chúng ta có thể thấy chỉ số về thời gian response trung bình, số lượng request trên phút.
5. Kết luận gì ở đây!
- Rõ ràng những thông số trên là cơ bản cho ứng dụng Nodejs. Bạn có thể tự tạo những biểu đồ cần thiết.
- Những hướng dẫn trên chỉ là cơ bản. Ngoài ra cần phải setup thêm về alert cảnh báo khi chỉ số đạt ngưỡng.
- Ngoài việc monitor về nodejs. Chúng ta cần phải monitor về database, queue… Hy vọng sẽ có những bài viết tiếp theo về vấn đề này.
- Source code mình để ở đây: typescript đơn giản tại nhánh
monitornha.